Weekly Meter
DC / MD / VA / WV
We compare contract activity for the same seven-day period of the previous year in Loudoun County, Prince William County, Northern Virginia, Washington, DC, and Prince George's County. These statistics are updated on a weekly basis. Sign up for our newsletter on the latest market data.

A Very Encouraging Week!
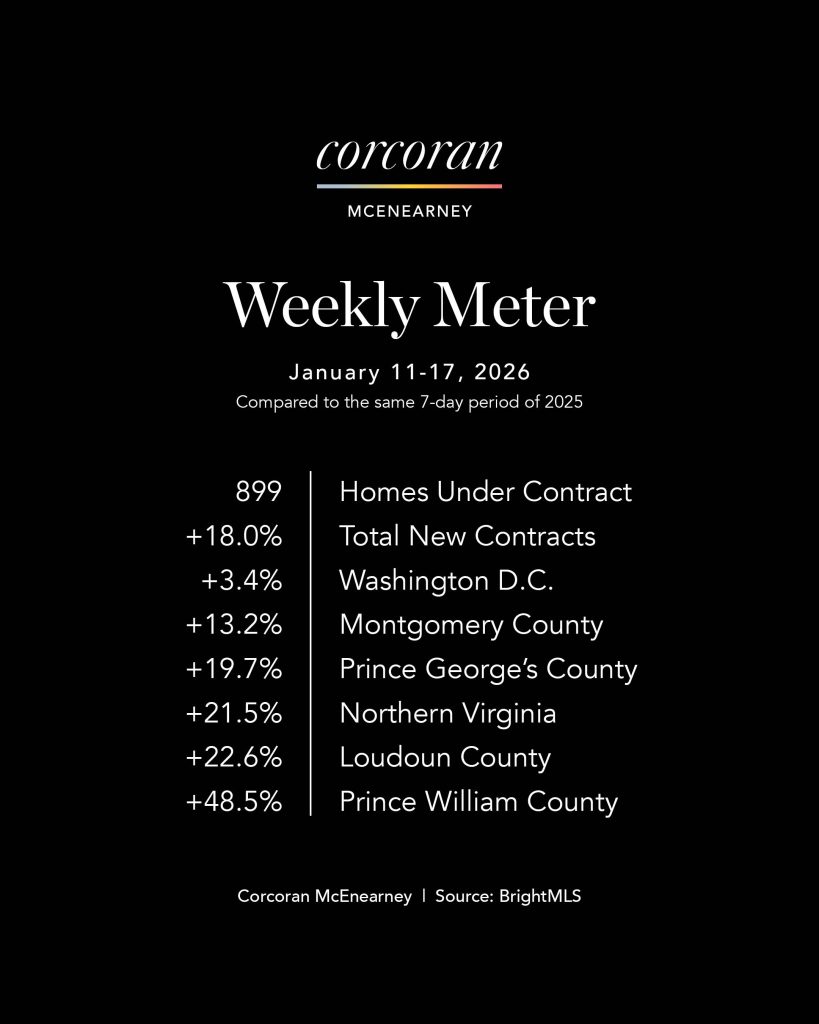
Contract activity for January 11 -17, 2026 in the Metro DC area was up 18.0% compared to the same seven-day period last year.
Key Takeaways
- There was a solid rebound in newly ratified contracts last week, as all six jurisdictions we track in this report posted increases.
- Northern Virginia posted a notable increase in weekly contract activity, up more than 20% compared to last year. Unlike last week, gains were not limited to sub-$750,000 homes; activity above $750,000 rose sharply as well, particularly in the $750,000–$1 million range. Year-to-date totals remain solidly ahead of last year. Average days on market increased again, reinforcing that buyers are active—but in no hurry.
- Loudoun County continued its steady, positive trajectory. Weekly contracts rose modestly, driven primarily by higher-priced homes, even as entry-level activity softened slightly. Year-to-date contracts remain well ahead of last year. Days on market jumped meaningfully, suggesting that buyers are engaging earlier but taking more time to commit.
- Prince William County reversed course in a big way this week. Weekly contract activity surged across nearly all price brackets, including strong gains both under and over $750,000. Year-to-date totals are now running comfortably ahead of last year. That said, average days on market nearly doubled, signaling a market with more activity—but also more deliberation.
- Montgomery County saw solid improvement, with weekly contracts up across both mid-range and higher-priced segments. Year-to-date activity is tracking ahead of last year, supported by strong gains above $750,000. Days on market rose sharply, reinforcing a theme that buyer interest does not equate to urgency.
- Prince George’s County posted one of the strongest weekly gains in the region, with increases across nearly every price category, including higher-end homes. However, year-to-date totals remain below last year, and days on market continue to climb, highlighting ongoing affordability and confidence challenges.
- Washington, DC showed modest improvement overall. Weekly contracts rose slightly, driven by strength under $750,000, while activity above $750,000 declined again. Year-to-date totals remain below last year, particularly in higher price ranges. Days on market remain elevated, underscoring persistent buyer selectivity.
Why It Matters
- Mortgage interest rates fell to a one-year low last week, and buyers took notice.
- The early-January pattern of cautious but consistent activity continues, but this week showed broader participation across price points than we saw just days earlier.
- Rising days on market across every jurisdiction confirm that this is a thinking market, not a rushing one. Days on market increased to 58 from 43 this time last year.
- With inventory continuing to build and more listings expected later this month, the next several weeks will be critical in determining whether this widening engagement translates into sustained spring momentum—or simply a longer runway.
A Very Sold Week!
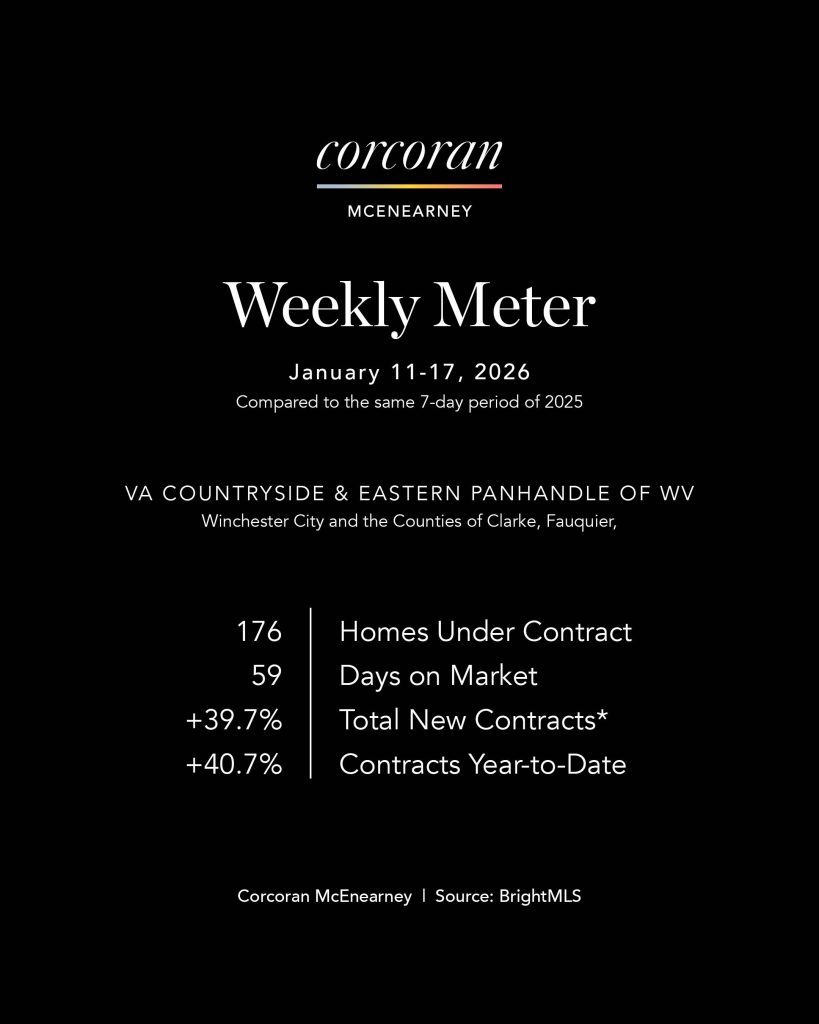
Contract activity for January 11 -17, 2026 in the Virginia Countryside and West Virginia Panhandle was up 39.7% (!) compared to the same seven-day period last year.
Key Takeaways
- There was a solid rebound in newly ratified contracts last week, as all six jurisdictions we track in this report posted increases.
- In the Virginia Countryside (Clarke, Warren, Frederick, Fauquier, Shenandoah, and Winchester City), weekly contract activity jumped sharply, up more than 50% year over year. Growth was broad-based, with especially strong gains under $750,000—most notably in the $500,000 to $749,999 range—but also meaningful movement above $750,000. Year-to-date totals are now running more than 30% ahead of last year, reflecting solid early-year engagement across both mid-range and higher-priced segments. Average days on market increased, suggesting that while buyers are active, they are taking more time to evaluate options.
- The West Virginia Panhandle (Berkeley, Jefferson, and Morgan Counties) also posted a strong weekly increase in contract activity. Gains were driven primarily by the $300,000 to $749,999 price ranges, with limited but notable activity appearing above $750,000—still unusual for this early in the year. Year-to-date contracts are modestly ahead of last year, supported by strength in the mid-price ranges. Average days on market rose significantly, reinforcing that buyer interest is present, but decision-making remains measured.
Why It Matters
- Mortgage interest rates fell to a one-year low last week, and buyers took notice.
- These more rural markets are showing healthier early-year momentum than is typical for mid-January, particularly in the mid-price ranges that tend to define overall activity.
- Rising days on market across both regions suggest that buyers are engaged but cautious—more willing to shop than to rush.
- If this level of activity holds as inventory gradually increases later this month, it would set the stage for a steadier, more balanced spring season rather than a compressed one.
The Real Estate Details
- Virginia Countryside was up 53.3% and is up 31.3% year-to-date.
- West Virginia Panhandle was up 27.3% and is up 9.4% year-to-date.


